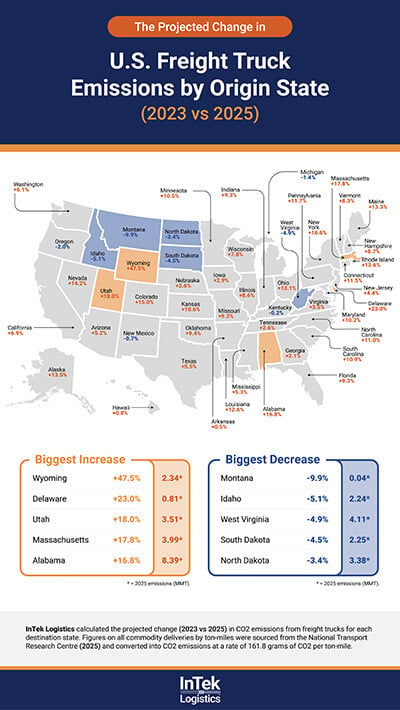
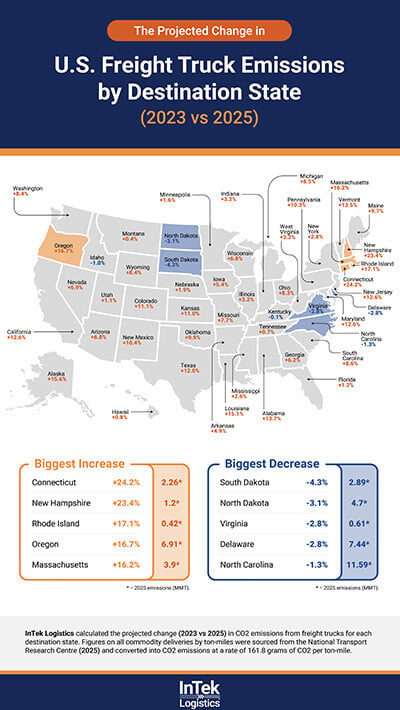
<img alt="" src="https://secure.perk0mean.com/182585.png" style="display:none;">

red-accent


Carbon Corridors

Many carbon corridors in the U.S. are particularly problematic when it comes to truckload freight's greenhouse gas contributions. See the freight lanes with the most issues and how to help solve them.

Request a Quote

About-Hero-curve

Ten States with the Highest Freight Emissions -
and How Intermodal Can Help

Trucking keeps the U.S. supply chain moving, but it also generates a significant share of the nation's carbon emissions when compared to rail or intermodal solutions. In 2023, total CO2 emissions from freight trucking across all 50 states reached 392 million metric tons. This figure is forecasted to rise to 420 million metric tons by 2025.

We examined the most delayed freight truck corridors using data from the Federal Highway Administration’s (FHWA)  and assessed the freight movement between states using ‘million ton-miles’ data from Freight Analysis Framework (FAF),  to pinpoint the locations with the highest trucking emissions. We then used the emissions formula from the Environmental Defense Fund to calculate the highest-emission state-to-state truck freight routes per year.

We analyzed where emissions are being generated and identified high-emission regions, key distribution hubs, and opportunities to reduce trucking’s environmental impact nationwide.

Whether the drive is from ESG or simply to improve cost efficiency, the need to reduce carbon emissions grows. These trucking emission insights help us understand the key locations across the U.S. for potential environmental and logistical improvements in the freight industry.

Truck Smokestack
Curve-grey-up-right

States with the highest truck freight emissions

To truly reflect trucking emissions per state, we have analyzed both freight origin and destination data, as each offers distinct insights:

  • The origin data highlight where emissions are generated, reflecting major freight-producing regions and their impact on supply chains. 
  • The destination data shows where goods are consumed or distributed, revealing high-traffic delivery hubs contributing to emissions. 

By comparing both sets of data per state, we gain a fuller picture of freight-related emissions, identifying key problem areas and potential opportunities for reducing environmental impact across the entire trucking network.

Texas, California, and Illinois rank among the highest-emission states for both freight origins and destinations. As major freight hubs, they contribute significantly to trucking emissions—but they also present key opportunities to reduce impact by shifting more freight to rail and intermodal transport.

State policies and infrastructure investments, such as New York’s Clean Truck Program, have influenced a reduction in truck reliance. However, states without such initiatives remain dependent on diesel trucks.

Freight origin states

Rank State Predicted CO2 Emissions (MMT)
1 Texas 59.76
2 California 38.75
3 Illinois 20.48
4 Florida 15.71
5 Ohio 15.34
6 Pennsylvania 13.72
7 Iowa 12.63
8 Minnesota 12.52
9 Georgia 12.44
10 New York 12.37


By predicting the origin truck emissions per state for 2025, we have identified 10 states as those with the highest trucking emissions.

By 2025, Texas is projected to lead state-to-state trucking emissions with approximately 60 million metric tons (MMT) of CO2, an increase of 3.11 million metric tons from 2023. This is followed by California (est. 39 MMT) and Illinois (est. 20 MMT). 

Texas has a vast freight network, with major ports like Houston and extensive highway corridors driving high trucking activity. California, a gateway for international trade, sees heavy truck traffic from the ports of Los Angeles and Long Beach. Illinois also facilitates high trucking activity with its central location that connects East Coast and West Coast freight routes.

The states with some of the biggest increases in trucking emissions between 2023 to 2025 are Pennsylvania (+12%), Ohio (+13%), and New York (+17%). Pennsylvania, Ohio, and New York are strong candidates for intermodal expansion due to their rising trucking emissions and strategic locations within the Northeast Corridor. Unlike California, Texas, and Illinois — where intermodal infrastructure is already saturated — these states have room for growth.

Ohio boasts key intermodal hubs, Pennsylvania prioritizes freight rail investment,  and all three states face severe highway congestion, making rail an effective alternative. Investing in intermodal solutions here aligns with regional emission reduction goals, reduces truck reliance, and eases congestion, offering both economic and environmental benefits in one of the most industrialized and densely populated U.S. regions.

Expand the map to explore U.S. freight truck emissions by origin state.

InTek Carbon Corridors - Projected change in freight truck emissions by origin state - U.S. map graphic

Freight destination states

Rank State Predicted CO2 Emissions (MMT)
1 Texas 56.65
2 California 38.36
3 Illinois 18.97
4 Florida 18.16
5 Ohio 15.51
6 Georgia 14.4
7 New York 13.31
8 Michigan 14.04
9 Pennsylvania 13.92
10 Minnesota 12.15


Our analysis of 2023 truck freight destination emissions reveal 10 states with the highest projected trucking emissions for 2025.

As with trucking freight origin emissions, the destination data projects Texas to have the highest trucking emissions at approximately 57 MMT, driven by its role as a major freight hub with strong industrial and port activity and increased cross-border freight movement with Mexico.

California (38 MMT) follows closely, largely due to high import traffic from its ports, expanding e-commerce demand and extensive agricultural shipments, especially in urban areas like Los Angeles and San Francisco. Illinois (19 MMT) and Florida (18 MMT) rank next, reflecting their importance in Midwest freight logistics and East Coast distribution.

Between 2023 and 2025, California’s trucking emissions as a freight destination are projected to rise by 12%, the highest increase across all states. This growth is driven by rising freight volumes from its major ports and continued economic expansion. Texas follows with a 12% increase, fueled by its strong industrial base, energy sector, and high freight activity. Pennsylvania’s freight destination emissions are set to grow by 10% due to its key position as a freight corridor connecting the Midwest and East Coast.

These trends highlight the need for cleaner freight solutions, such as low-emission truck technology, in destination ports to curb rising emissions in these high-impact states.

Expand the map to explore U.S. freight truck emissions by destination state.

InTek Carbon Corridors - Projected change in freight truck emissions by destination state - U.S. map graphic
Curve-grey-down-left-new


Freight truck emissions in major U.S. metros

Certain metropolitan areas have higher truck freight emissions due to ports and distribution hubs for freight origins and destinations. Cities like Los Angeles, CA, have significantly higher destination freight emissions (16 MMT in 2023) than other metros due to their massive port activity, particularly at the ports of Los Angeles and Long Beach, which handle a large portion of U.S. imports. This creates constant truck traffic, moving goods inland. Its dense urban population also increases local freight demand. Our forecasted freight origin emission data also states that Los Angeles has the highest emissions for 2025 (18 MMT) when compared to other metros.

Detroit, MI, also has a major manufacturing and logistics hub but has lower trucking destination emissions (6.3 MMT in 2023) than other metros in part because the automotive industry relies more on rail than trucking for long-haul freight. The region has extensive rail connections, and many automotive suppliers are located close to assembly plants, reducing the need for long-distance truck transport. 

Dallas-Fort Worth, TX, is predicted to have one the highest freight origin emissions when compared to other metros, with 14 MMT in 2025, a growth of 1.03 MMT from 2023. Our destination freight data predictions also seeing Houston, TX, increase its emissions for 2025 by nearly 3 MMT. Destination freight emissions for Houston will go from 9.01 MMT in 2023 to 12 MMT in 2025. This emissions growth in Houston could be attributed to the major trucking routes like the I-10 and I-45 interstates, which funnel large volumes of freight through the metropolis, intensifying congestion and emissions.

LA Traffic Overhead

How intermodal shipping helps tackle freight emissions

Intermodal transportation—integrating rail, trucking, and ports—reduces freight emissions by shifting long-haul shipments from trucks to rail, which is four times more efficient than trucking. A shift to intermodal also helps ease highway congestion on major freight corridors like I-35 in Texas and US-101 in California.

Another benefit of intermodal transportation is that it provides a sustainable supply chain solution by cutting emissions while maintaining efficiency. One train moves the equivalent of 280 trucks, and rail can transport one ton of freight 450 miles on a single gallon of fuel, drastically cutting fuel consumption and carbon output. 

With InTek’s expert support with efficient planning and route optimization, you can achieve a SmartWay certification through the EPA by building intermodal into your transportation strategies.

Rick LaGore 9


Rick LaGore, CEO of InTek Logistics, emphasizes the dual benefits of intermodal shipping for sustainability and cost-effectiveness.

"Intermodal brings significant environmental advantages and substantial cost savings compared to traditional truckload transportation. By choosing intermodal services, companies can make a meaningful impact on reducing carbon emissions while boosting their logistical efficiency." 

Curve-Blue-down

Choose InTek as your
freight and logistics partner

Freight is a major contributor to emissions, with traffic congestion and idle trucks worsening air pollution and emission intensity. Heavy-duty trucks are the fastest-growing source, making it critical for industry leaders to act.

As intermodal specialists, at InTek, we prioritize long-term partnerships and delivering cost-effective, sustainable shipping solutions for your business. Our operations specialists combine deep industry knowledge with a commitment to tailored solutions, ensuring seamless integration into your logistics strategy.

To cut costs, reduce emissions, and improve supply chain sustainability, contact InTek’s expert team today to explore intermodal options for your business.


SPEAK TO OUR FREIGHT SPECIALISTS