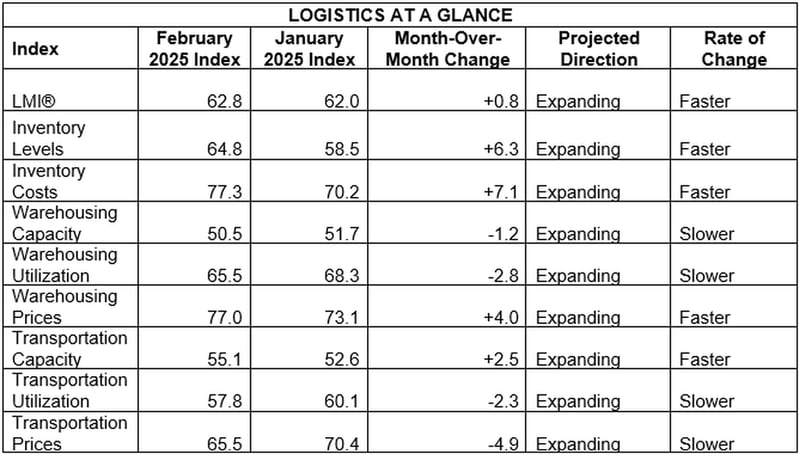
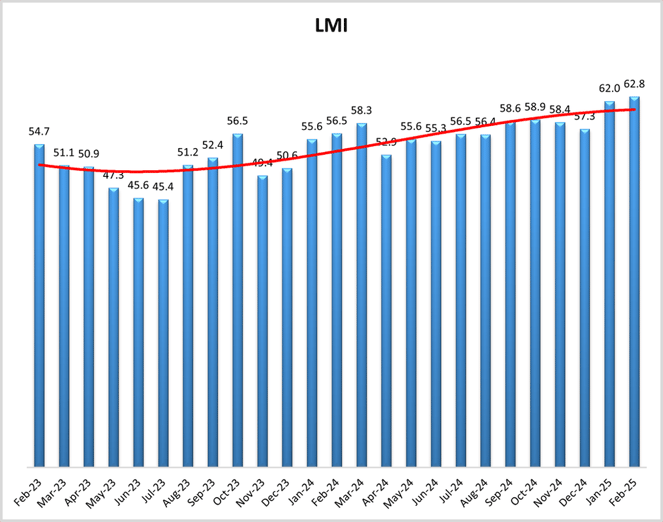
After hitting a previous high in January, the Logistics Managers' Index (LMI) saw another gain last month, putting it at its highest overall figure since June 2022. The February LMI was up 0.8 from the month prior, coming in at that high-water mark of 62.8.
Inventory levels are the primary driver of the upward movement, as that metric jumped 6.3 to 64.8 - coincidentally its best reading since the same mid-summer 2022 timeframe. The reason behind the increase may still connect to companies pulling products together to beat potential tariffs - many of which are no longer potential as of today. That move to bring in goods to beat the levies (a definite shift from the recent just-in-time trend) also led to higher Inventory Costs, which jumped 7.1 to 77.3 - the highest index metric - and Warehousing Prices, just behind at 77 after a four-point gain. Warehousing Utilization incidentally was down 2.8 to 65.5 with Warehousing Capacity also off slightly (-1.2) TO 50.5.
Getting to the other key numbers that many are following, Transportation Prices took a hit, dropping 4.9 to 65.5, while Transportation Utilization also declined 2.3 to 57.8. Both still remain comfortably in expansion, but the rate of expansion clearly slowed. Also a bit troubling for the idea of a freight recovery, Transportation Capacity was up 2.5 to 55.1. The gap between Capacity and Prices narrowing to about 10 is still a reasonable suggestion of a positive direction for freight, but that gap has been bigger in previous months. Transportation Utilization also dropped back (-2.3) to 57.8, its lowest number since last July - though authors suggest that is more likely a blip.
Despite the current uncertainty regarding trade policy and its potentially large effect on freight volumes (as well as a few other market red flags), logistics pros are still showing optimism about the market in 12 months. The future index was up 0.1 to 66.2, comfortably above the all-time LMI average and up more than three points from the current figure. And just like the current reading, Inventory Levels are expected to lead the way, with pricing metrics all significantly higher as well.
By the Numbers
See the summary of the February 2025 Logistics Managers' Index, by the numbers:


About the Logistics Managers' Index (LMI)
Researchers at Arizona State University, Colorado State University, Rochester Institute of Technology, Rutgers University, and the University of Nevada, Reno - in conjunction with the Council of Supply Chain Management Professionals (CSCMP) - issue the report. The LMI score is a combination of eight unique components that make up the logistics industry, including: inventory levels and costs, warehousing capacity, utilization, and prices, and transportation capacity, utilization, and prices. The LMI is calculated using a diffusion index, in which any reading above 50.0 indicates that logistics is expanding; a reading below 50.0 is indicative of a shrinking logistics industry. The latest results of the LMI summarize the responses of supply chain professionals collected in February 2025.
Need assistance with your shipping operations? Request a quote with us, and we'll get back to you to discuss your unique needs. Go to our Freight Guides to learn more about everything freight and logistics. Additionally, visit our blog for information and updates on the freight industry.


